Pipeline de données
From Ad Hoc Scripts to Reliable Data Flow
Many teams start with manual exports, one-off SQL queries, and spreadsheet uploads.
Over time, this patchwork becomes slow, brittle, and hard to debug.
A data pipeline replaces those fragile steps with a defined sequence of transport and transformation processes.
Data moves along a path on a schedule or in near real time, under rules that you can inspect and improve.
Data Pipeline: A Working Definition
A data pipeline describes the end-to-end route that data follows from sources to destinations.
Along that route, each stage performs a specific task and hands structured output to the next stage.
The pipeline might:
Read change events from databases and logs
Clean and standardize values
Enrich records with reference data
Load curated outputs into warehouses, lakes, or search indexes
Instead of dozens of isolated jobs, you get one coordinated flow.
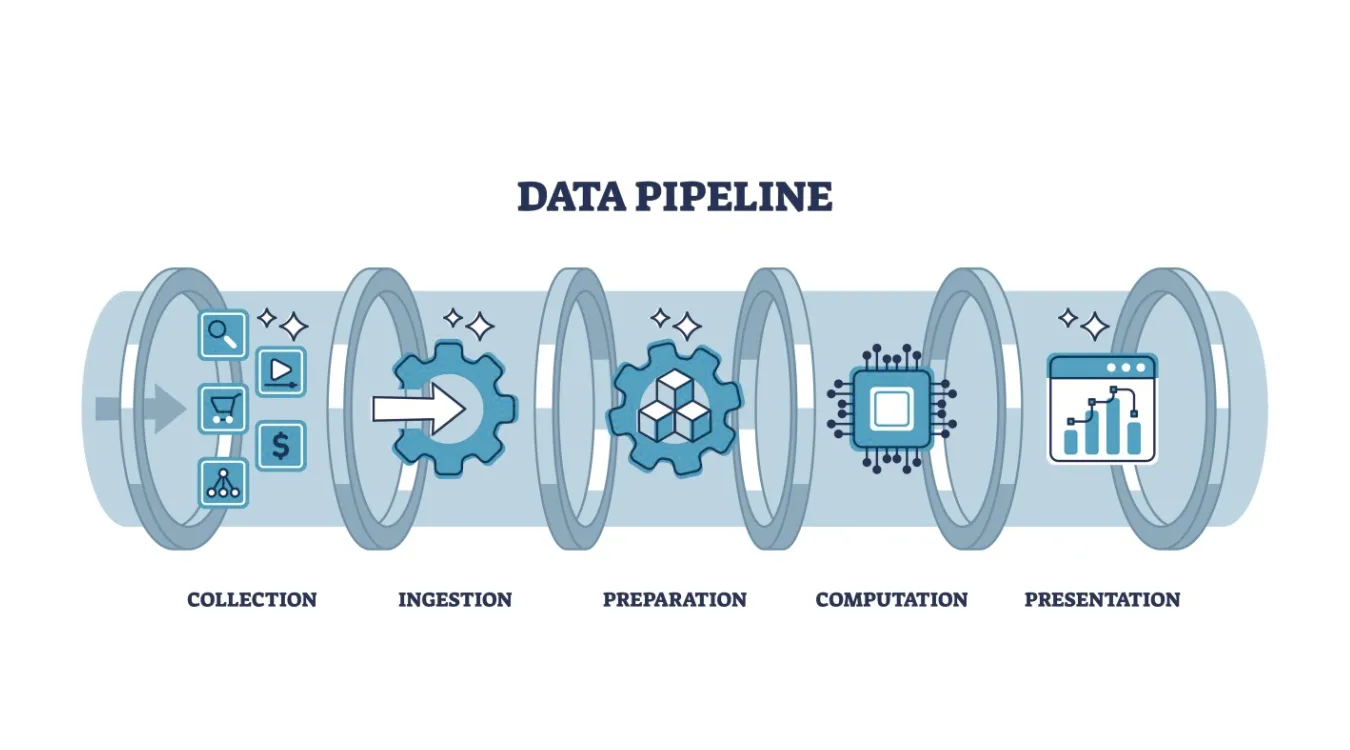
Core Stages and Their Responsibilities
Most pipelines reuse the same functional building blocks, even when tools differ.
Ingest and Capture
The ingest stage connects to systems that produce data: applications, databases, APIs, devices, or files.
It copies or streams new records into a durable landing zone such as message queues, staging tables, or object storage.
Key goals here:
Avoid silent data loss
Handle spikes in volume gracefully
Preserve original records for replay when needed
Transform, Validate, and Enrich
The transform stage turns raw events into analytics-ready data.
Typical jobs:
Normalize types, time zones, and field names
Enforce validation rules and drop or quarantine invalid rows
Join streams or tables to add context (customers, products, regions)
Compute metrics such as totals, averages, and flags
You protect downstream work by enforcing quality at this step instead of inside every report.
Load and Serve
Finally, the pipeline loads cleaned data into target systems:
Data warehouses for BI and SQL analytics
Data lakes for large, flexible storage
Search indexes for log and event exploration
Feature stores or APIs for machine learning and applications
Dashboards, alerts, and tools can then read from these consistent, documented structures.
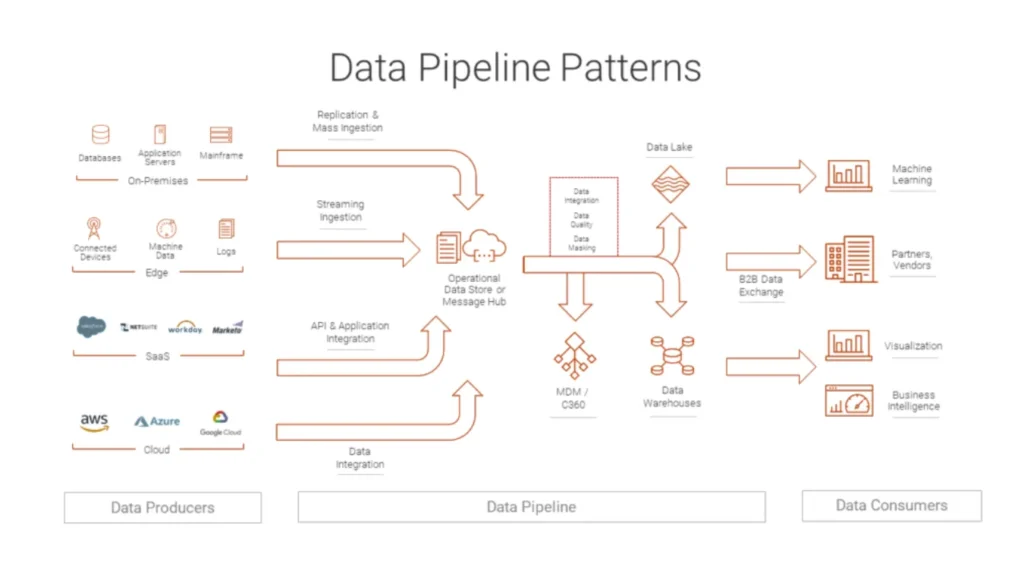
Pipeline Styles: Batch, Streaming, and Mixed Models
Different workloads call for different pipeline styles.
Batch pipelines run on a schedule, often every hour or day.
They suit financial summaries, daily backups, and regulatory reports.Streaming pipelines process events continuously as they arrive.
They support monitoring, anomaly detection, and near real-time dashboards.Micro-batch pipelines group small time windows for a balance between latency and simplicity.
Many organizations run a hybrid design: streaming for time-sensitive metrics, batch for heavy historical processing.
Reliability, Recovery, and Reprocessing
A data pipeline adds value only when it behaves predictably during failure.
You design it so jobs can restart and reprocess without duplication or corruption.
Important practices:
Use checkpoints or offsets to track progress through streams and files.
Keep transformations idempotent, so reruns produce the same result.
Store raw inputs in a replayable format to support backfills after bugs.
Capture detailed error logs and rejected rows for later inspection.
When you follow these rules, recovery from failures looks like routine maintenance instead of crisis work.
Observability and Data Quality Signals
You need visibility into both system health and data quality.
Without that, pipelines can produce wrong numbers quietly.
Useful metrics and checks:
Records in versus records out at each stage
Processing latency across ingestion and transformation
Counts of rejected or quarantined rows by reason
Simple profiling metrics such as null rates or value ranges
Schema drift detection when upstream systems change fields
Dashboards built on these signals show where bottlenecks, errors, or quality regressions appear.
Data Recovery Logs Inside a Pipeline
Backup and recovery workflows also benefit from pipelines.
Instead of leaving logs scattered across machines, you can treat them as a data source.
For example, when Amagicsoft Récupération de données runs scans and recoveries, you can:
Export job logs and summaries to files or a database
Ingest those records into a central pipeline
Transform them into consistent fields: device IDs, sizes, durations, outcomes
Load the results into a warehouse or dashboard
Teams then track recovery success rates, detect patterns in failures, and plan capacity with real evidence.
Prend en charge Windows 7/8/10/11 et Windows Server.